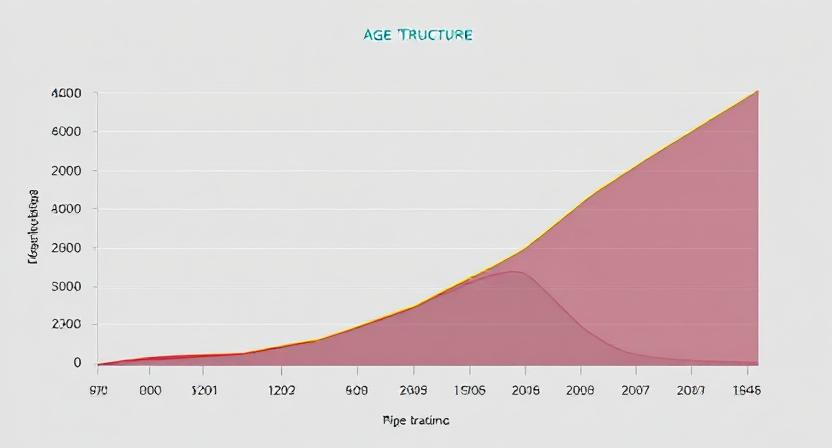
Understanding the relationship between age structure diagrams and a country’s GDP per capita offers valuable insights into economic development and future growth potential. While many factors influence a nation’s wealth, the age distribution of its population plays a crucial role. Countries with balanced or mature age structures often have a higher per capita GDP, largely due to a productive workforce and lower dependency ratios.
In this article, we’ll explore how age structure diagrams relate to GDP per capita, why some demographic profiles are more favorable than others, and how nations can use this information for economic planning.
What is an Age Structure Diagram?
Understanding Population Pyramids
An age structure diagram (also known as a population pyramid) is a graphical illustration that shows the distribution of various age groups in a population, typically separated by gender. The horizontal axis represents population size, and the vertical axis displays age groups in intervals (e.g., 0–4, 5–9, etc.).
There are three main types of population pyramids:
-
Expansive Pyramid – Broad base, indicating a high birth rate.
-
Constrictive Pyramid – Narrower base, indicating a declining birth rate.
-
Stationary Pyramid – Roughly equal numbers across age groups, typical of developed nations.
What is GDP Per Capita?
GDP per capita is a measure of a country’s economic output divided by its population. It shows the average income of a person in a given nation and is commonly used to compare the standard of living across countries.
Formula:
GDP per capita = Gross Domestic Product / Total Population
A higher per capita GDP typically reflects a more productive, industrialized economy with better quality of life, healthcare, and infrastructure.
How Does Age Structure Impact GDP Per Capita?
1. Working-Age Population and Economic Productivity
A key factor linking age structure to GDP is the proportion of working-age individuals (usually defined as ages 15–64). Countries with a large, healthy, and skilled working-age population generally experience:
-
Higher labor force participation
-
Greater economic output
-
Increased tax revenues
-
Lower dependency burdens
When viewing an age structure diagram, a balanced or slightly constrictive pyramid with a dominant middle age group suggests a strong economic engine.
2. Dependency Ratio and Economic Burden
The dependency ratio is the ratio of people not in the labor force (ages 0–14 and 65+) to those in the working-age population. A low dependency ratio often indicates:
-
More resources available for investment rather than consumption
-
Greater public spending efficiency
-
Less pressure on health and pension systems
Countries with lower dependency ratios often have higher per capita GDP, as more people contribute to the economy than depend on it.
Comparing Countries: Case Studies
High GDP per Capita Countries
Countries like Germany, Japan, and South Korea showcase constrictive or stationary age pyramids. These nations:
-
Have aging populations
-
High education and skill levels
-
Low birth rates but high productivity
-
Advanced healthcare and infrastructure
Despite aging challenges, these countries maintain high per capita GDP because of strong institutions, technological innovation, and past demographic dividends.
Lower GDP per Capita Countries
Nations such as Nigeria, Ethiopia, or Afghanistan often have expansive pyramids:
-
High fertility rates
-
Large youth populations
-
Limited job opportunities
-
Lower investments in education and healthcare
While they may have large populations, the economic output per individual remains low, dragging down per capita GDP.
Why Countries with Mature Age Structures Often Have Higher GDP per Capita
1. More Skilled Workforce
Education tends to improve over time. Older and more developed populations usually have had generations of access to education, creating a skilled and employable labor force.
2. Established Economies and Institutions
Mature age structures often correlate with developed economies. These nations have:
-
Diversified economies (services, tech, manufacturing)
-
Legal systems that support business
-
Infrastructure that boosts productivity
3. Slower Population Growth
Moderate or negative population growth reduces the pressure on resources, infrastructure, and services. This allows for more focused investments per capita, enhancing GDP metrics.
Future Trends: Youth Bulge and Economic Opportunity
It’s important to note that a youthful population is not inherently negative. If countries with expansive pyramids can invest in:
-
Education
-
Job creation
-
Healthcare
-
Women’s empowerment
They could harness a “demographic dividend”, potentially boosting their per capita GDP significantly in the coming decades. However, failing to do so may lead to increased unemployment, poverty, and social unrest.
Can Age Structure Predict Economic Growth?
Using Age Structure Diagrams for Economic Planning
Policymakers and economists analyze age pyramids to forecast:
-
Future labor supply
-
Pension and healthcare burdens
-
Economic growth trajectories
-
Educational and training needs
For instance, a country with a growing elderly population must prepare for increased healthcare and pension expenses, which can strain the GDP unless counterbalanced by strong economic growth or immigration.
Conclusion
The age structure diagram of a country tells more than just its demographic profile—it offers critical clues about its economic health and future growth potential. Countries with a mature or balanced age structure often have a higher per capita GDP, thanks to a productive workforce, lower dependency burdens, and advanced infrastructure.
However, age structure is just one of many factors affecting GDP. Education, political stability, innovation, natural resources, and global trade also play significant roles. Still, understanding and analyzing age structure diagrams is a powerful tool in economic forecasting and planning.
Key Takeaways
-
Age structure diagrams show the distribution of a population by age and sex.
-
Countries with balanced or constrictive pyramids often enjoy higher GDP per capita.
-
A large working-age population supports productivity and reduces dependency burdens.
-
Expansive pyramids can be opportunities or challenges, depending on investments in human capital.
-
Age structure analysis is vital for long-term economic and policy planning.


